Main Window
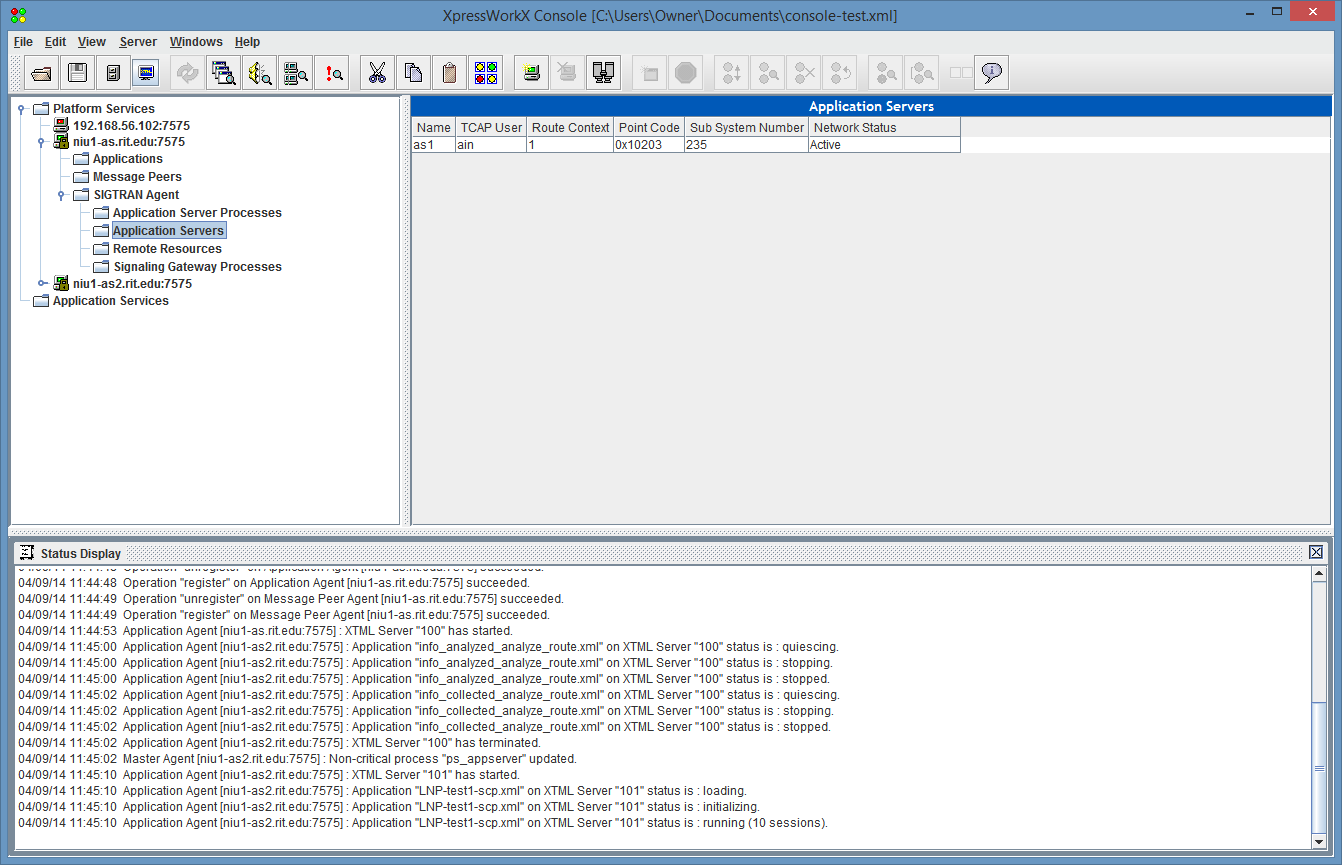
The Evolve ® IMSWorkX Console is a software tool used to monitor applications and media servers running on the Evolve IMSWorkX Application Server. The Console is fully backwards compatible with all versions of Evolve IMSWorkX servers and provides some of the same functionality as an Element Management System commonly used in telecommunications.
The Console supports the following features:
configuring and monitoring SIP applications running on application servers
configuring and monitoring IN applications running on application servers
connecting to both secure and unsecure servers
Note
For secure servers without certificates, connect as you would to an unsecure server. By default, the Console uses TLS-DH to connect.
monitoring the server inventory and endpoints on media servers
viewing connection states between message peers
viewing log files
managing licenses
receiving and displaying SNMP traps
For information about configuring the Console connections, see the Application Server User’s Guide.
The secure Console protocol uses TLS at all times, though without explicit configuration, and the encryption provides no guarantee of identity or protection against man-in-the-middle attacks. The implementation internally makes use of OpenSSL on the server side.
The Console displays service hosts in the Object panel. These hosts can be explicitly added, or they can be found using the Discover feature. Each service host can have any of the following types of service agents:
applications
media servers
message peers
The service agents are either manually configured or automatically added through the Discover feature (see Add Service Hosts). When service hosts have been added, they can be saved in a configuration file and be reopened upon subsequent use of the Console.
When you select an object in the Object panel, information about the selected object is displayed in the Information panel. These service agents display the following information:
applications: all applications running on the associated service host
media servers: all media servers on the associated service host
message peers: all connections from the associated service host to other service hosts
In addition, the Console allows you to navigate and obtain more detailed information about service agents. For example, if you select media servers, you can view information about endpoints on this media server, or if you select message peers, you can view outage logs for its peers.
You can also use the Console to perform management functions such as starting and stopping sessions (see Terminate or Restart Sessions) or applications (see Start an Application and Stop an Application).
The Console also allows you to:
view all agents of a particular type across all service hosts
view SNMP traps (if configured)
view usage statistics
monitor connections
manage application licenses
browse log files

The tool bar at the top of the main window provides access to many commonly used functions. You can change the color of the tool bar using the Custom Menu Color button. This feature is useful to differentiate between instances of the Console when several are running at once.
Change Tool Bar Color
Click the Custom Menu Color button in the tool bar.

From the grid, click to select the color for the tool bar. A preview of the color appears in the window.
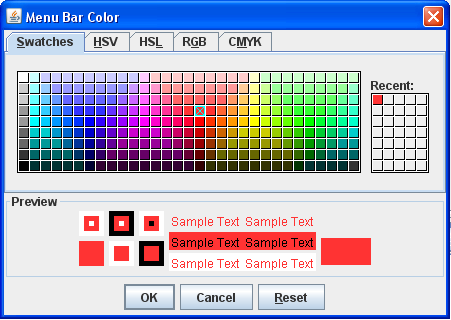
Click OK. The tool bar changes to the color selected.

The Object panel displays the configured hierarchical view in the top, left panel.

The various service host icons have the following meanings:
green console - The service host is running and able to communicate.
red console - The service host is unable to communicate.
yellow console - The service host is on standby.
orange console - The host database is in an error state.
locked console (padlock icon) - This is a secure instance.
The Information panel appears next to the Object panel and displays information about the children of the item selected in the Object panel.
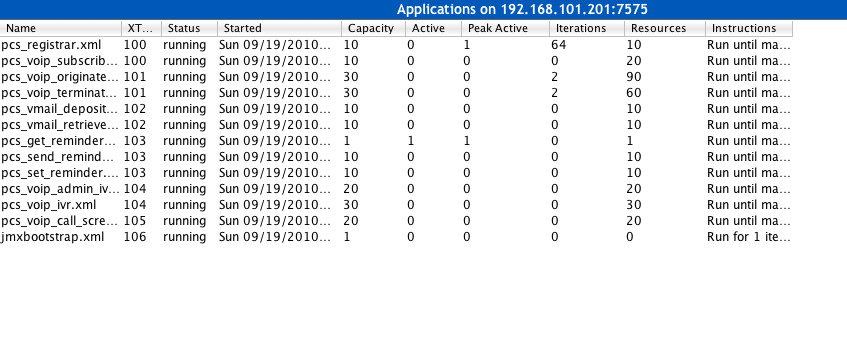
The fields displayed in the Information panel vary depending on what is selected in the Object panel. You can select the following in the Object panel:
Service Host IP Address
Applications
Media Servers
Message Peers
Application Server Processes
Application Servers
Remote Resources
Signaling Gateway Processes
The following tables list and describe the display fields for each selection.
Field |
Description |
|---|---|
Service Agent |
The types of service agents available on the service host can be any combination of applications, media servers, and message peers. |
Contact Status |
The contact status displays the status of the connection between the Console and the service host. When connection is established, Connected is displayed. If, at any time, the Console loses the connection with the service host, Not Responding is displayed until the connection is re-established. When the Console receives notification that the services are terminated, Not Running is displayed. Note The Console continues to try to re-establish a connection after it is lost. |
Details |
The last start of the service host. |
Field |
Description |
|---|---|
Name |
The name of the application. |
XTML Server |
The Evolve IMSWorkX Application Server ID of the XTML application server process on which the application is running. Each application can run on its own server process or multiple applications can run on a single server process. |
Status |
The current status (idle, loading, initializing, running, quiescing, or stopping). When the status of an application has changed to stopped, this field is removed from the Console display. |
Started |
The date and time the application is started. |
Capacity |
The number of sessions configured and licensed to run. |
Active |
The number of sessions that are busy. This field is updated every five seconds. |
Peak Active |
The largest number of simultaneous sessions hosted by the application. |
Iterations |
The number of iterations that have been executed by the application across all sessions. For example, this value may correlate to the number of calls that are processed by the application. |
Resources |
The number of resources currently owned by all sessions of the application. A resource can be an endpoint, a file handle, a timer, or a SIP dialog. Note All resources are freed when the session exists. |
Instructions |
The designation whether the application has been configured to run once and exit, run a specific number of iterations and exit, or run continuously until manually stopped. |
Field |
Description |
|---|---|
Name |
The name of the media server. Note The naming convention is the type of the media server @ (at) the IP address of the media server’s Operations, Administration, Maintenance, and Provisioning (OAMP) interface. |
Media Server Status |
The connection status of the media server (initializing or connected). |
Capacity |
The total number of configured and licensed endpoints available. |
Endpoint Status |
A summary of the number of active endpoints and their types (IVR or Conference). This field is updated every 5 seconds. |
Peak Active |
The peak number of active endpoints and peak number of connections used since the last reset of the statistics or the last start of the media server. You can reset the peak threshold by selecting . |
Connection/Task Status |
A summary of the number of active connections in use by a task (play, record, or conference). |
Field |
Description |
|---|---|
Remote Peer |
The host name or IP address and port number of another service host that communicates with the selected service host. |
Connection State |
The state of the connection between the remote peer and the selected host (send/receive, send only, receive only, or disconnected). |
Details |
Specific information about the connection configuration. |
Note
When you select an individual message peer in the Object panel, an outage log is displayed in the Information panel which may be useful to diagnose lost connections between service hosts.
Field |
Description |
|---|---|
Standard |
Standard protocol used by the application server (ANSI or ITU). |
Local ASP ID |
Local application server process ID. |
Current Transactions |
The current number of transactions being handled by the application server. |
Max Transactions |
The maximum number of transactions that can be handled by the application server. |
Peak Transactions |
The largest number of transactions that have been handled by the application server. |
Field |
Description |
|---|---|
ASP ID |
Application server process ID. |
Status |
Specific information about the status of these processes. |
Field |
Description |
|---|---|
Name |
Name of the application server. |
Route Context |
The route context of the application server. |
Point Code |
Address of the application server. |
TCAP User |
The TCAP user of the application server. |
Subsystem Number |
Number that identifies the application server in the network. |
Network Status |
Application server network status. |
Field |
Description |
|---|---|
Subsystem Number |
Number that identifies the remote resource. |
SS Status |
Status of the subsystem. |
Point Code |
Address of the remote resource. |
PC Status |
Point code status. |
Field |
Description |
|---|---|
Signaling Gateway |
Signaling Gateway (SG) paired with the signaling gateway process. |
Signaling Gateway Process |
Specific Signaling Gateway Process (SGP). |
Connection Status |
Connection status of the SGPs and the SG with which they are paired. |
The Status panel displays a history of all actions that took place during a session using the Console. These actions are typically system events such as starting or stopping services or applications and the loss or gain of connectivity to service hosts.
The Status panel is useful to determine whether the Console has effective communication with service hosts and, if not, to determine the reason for the lack of the communication.

Secondary windows are opened from the Windows menu and are automatically displayed at the bottom of the main Console window. When a new window opens, all windows and panels are automatically resized to fit the screen.
Note
You can display secondary windows in a separate window by selecting .
Note
The available options in the Windows menu may vary based on application.
From the License Manager window, you can add, delete, and modify licenses (see Manage Licenses).
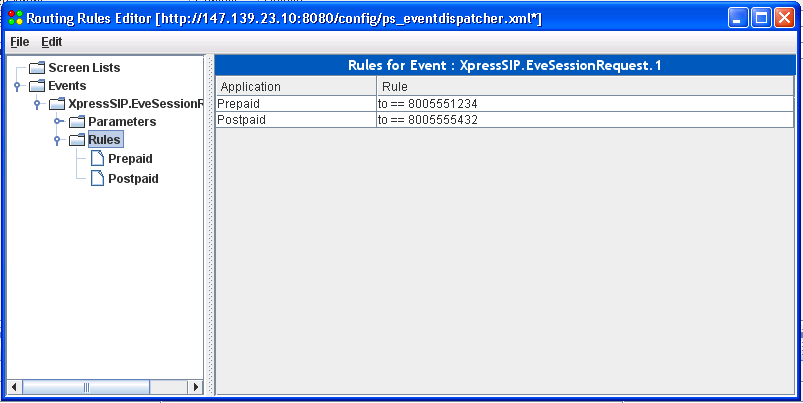
From the Routing Rules Editor window, you can modify the rules language on the NIU server (a SIP proxy) that determines how SIP requests are directed to the service hosts. The rules language is defined in the Application Server User’s Guide.
The Application Manager window provides a method for installing, removing, and managing Evolve IMSWorkX applications for hosts that have Application Manager installed.
The Application Manager tracks the full name, short name, version number, and installation date of each application package. To use this feature, you need to set up an SSH key.
To access this window, right-click on the host and click Application Manager.
From the Role Manager window, you can add, edit, and remove server roles. To use this feature, you need to set up an SSH key.
To access this window, right-click on the host and click Role Manager.
The Configuration Manager detects the files on the remote host and downloads the files locally. To use this feature, you need to set up an SSH key.
The Configuration Manager window displays a complete listing of all the host files that can be edited locally, and you can edit files, discard or commit changes, and view the differences between files. When you view the changes in a file, the text highlighted in red is old or removed text and the text highlighted in green is new text.
The Console is checking a static list of files. If a file is deleted or its name or path is changed, it will not be detected, and it will not be listed in the Configuration Manager window.
If a file is not found, the Console will look for the template. If only the file is found, you can edit the file. If only the template is found, you can edit the template and commit changes to the file. If neither is found, an error message is generated and an editor is opened.
The All Message Peers View window shows all message peer connections on all service hosts instead of having to visit each active message peer in the Object panel hierarchy. As connections start and stop, this view is automatically updated.
Note
The actions that can be performed from the Object panel on these items also can be performed from this window.

You can use both the service hosts and the NIU SIP Proxy as an active and/or standby High Availability (HA) cluster. If the service hosts and the NIU SIP Proxy are configured as such, the HA Cluster Status window allows you to view their status.
This window shows the active service host with the color green and the standby service host with the color yellow. If shown with the color orange, the host database is in an error state. If shown with the color red, this service host is not running or cannot be reached on the network.
Note
You can use the actions provided in this window to manipulate the service host and the NIU SIP Proxy. For example, you can manually trigger a failover that switches all traffic from one service host to another service host.
The Trap Display window shows all traps sent from SNMP-managed devices to the host on which the Console is running. The devices are typically configured (external to any Console functionality) to send traps to a particular host on a particular UDP port (port 162 by default).
This window shows only those traps received after the time when the Console was started. The traps appear highlighted until you acknowledge the respective trap.
Note
This interface provides a simplistic view of an SNMP management console and is not intended to be a replacement for a commercial SNMP management station.
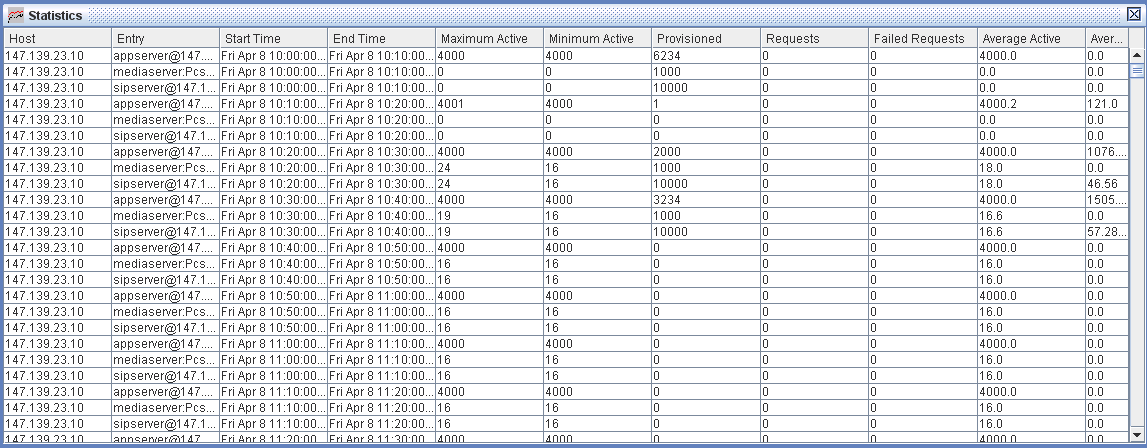
The Statistics window displays the usage statistics for a wide range of values. This dashboard display provides an overview of the entire system across all service hosts.
The SIP Statistics window displays SIP-specific statistics showing the number of each SIP request that has been processed for all service hosts.

The All Applications View window displays information relevant to all applications running across all service hosts and a summary of the Information panel when a specific application is selected.
In this window, fields can be sorted to get a clearer assessment of the current system usage. Click a specific heading to sort by the values in that column. The values are automatically added for all service hosts by the system and are displayed as the Load Summary at the bottom of the page.

The Monitor Sessions window is accessed by right-clicking on a specific application in the All Applications View window. This window displays the number of sessions that are busy (executing) and idle (waiting for a new request) for the selected application.
Busy sessions are indicated with a green circle, and idle sessions are indicated with a yellow circle. Sessions that are not responding are indicated with a red circle and should be restarted (see Terminate or Restart Sessions).
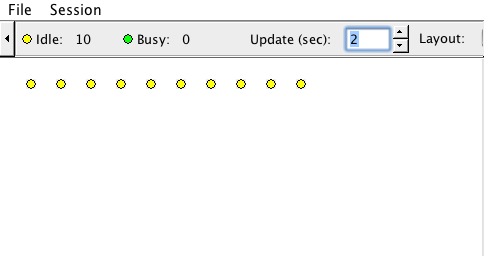
In the top, right corner of the Monitor Sessions window are the Update and Layout fields. The Update field allows you to adjust the interval for how often the Console refreshes the session status and details (see Show Session Details). For example, if you select 2, the information is refreshed every 2 seconds. The Layout field allows you to modify how the indicator circles are displayed to better use the space in the window.
Note
If you want the Console to automatically select the display, leave the Layout field blank.
Viewing the details of a specific session can help to quickly diagnose problems during that session. This type of system monitoring is similar to using a debugging tool for a process but is implemented at the application level.
Details of a session include the following:
all active functions
Plug-in Action Components (PACs) in use
state of any active timeouts associated with a PAC
state of any timer that has been started in the session
resources in use
Note
PACs implement the building blocks for laying out the call flow in the Evolve IMSWorkX Service Creation Environment (SCE). For more information, see the Service Creation Environment User’s Guide.
Terminate or Restart Sessions
Right-click the circle associated with the session.
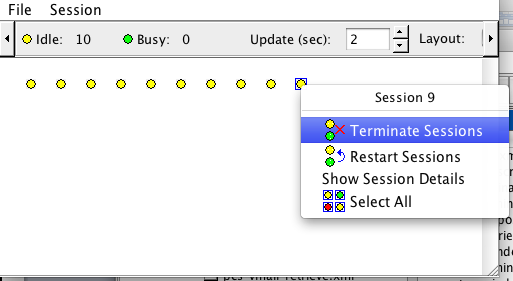
Select Terminate Sessions or Restart Sessions.
Show Session Details
Right-click the circle associated with the session.
Tip
Use the arrow keys to move up and down the window.
Select Show Session Details. A window with the current execution stack of the session appears.

Click the buttons in the window to do the following:
► will continuously update the window with the real-time state of the execution stack.
❚❚ will stop the continuous update the window with real-time information.
◼ will close the monitor window.
Tip
To perform an action on multiple sessions at the same time, click the circles while pressing the Ctrl key, and then perform the action.
The All Media Server View window displays information relevant to all media servers in the Console. The information displayed in this window is a summary of the same information that is displayed in the Information panel when a specific application is selected.
In this window, fields can be sorted to get a clearer assessment of the current system usage. Click a specific heading to sort by the values in that column. The values are automatically added for all service hosts by the system and are displayed as the Load Summary at the bottom of the page.

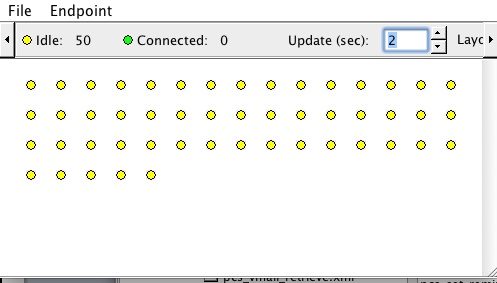
The Monitor Endpoints window displays the active and idle endpoints of the selected media server.
Active endpoints are indicated with a green circle, and idle endpoints are indicated with a yellow circle. Endpoints that are not connected are indicated with a red circle and should be restarted.
Show Endpoint Details:
Right-click the circle associated with the endpoint.
Tip
To view details for multiple endpoints at the same time, click the circles while pressing the Ctrl key, right-click outside the selected area, and then proceed to the next step.
Select Details. A window with the current execution stack of the endpoint appears.

The following details are shown:
endpoint call ID
endpoint session ID
last command sent from the media server agent to the media server for this endpoint
last response sent by the media server agent for this endpoint
list of all open connections on the endpoint
call ID and session ID for each connection that is associated with the respective connection
list of codec values for the endpoint
Click the buttons in the window to do the following:
► will continuously update the window with the real-time state of the execution stack.
❚❚ will stop the continuous update the window with real-time information.
◼ will close the monitor window.